 1300 38 66 34
 Tax variation form - The quickest way to improve your cashflow as a property investor.
Cash-flow is the lifeblood of any business, and property investing is your scalable business. Few, if any want to pay more tax during the year than required (although more tax = more profitable income, so some might argue oterwise), but why wait for it tax dollars back, when you can put it to better use now.
For example, these reduced tax deductions increase your take home pay each week and could contribute to increase the cash input required in servicing your loan.
Rather than wait for the annual tax return to be repaid in one lump sum at the end of the financial year, be paid directly each pay period. Whatever that equates to for you, you'll receive additional in your pay each week for the remainder of this financial year. This additional cash flow can be used to:
- Improve your lifestyle
- Repay debt faster
- Improve the position of an offset account
- Save
- Re-invest
What is the PAYG Income Tax Withholding Variation?
An Income Tax Withholding Variation (ITWV), is an annual application made to the ATO to vary the amount of tax withheld from your salary each pay by your employer.
This variation is valid for the entire financial year. It simply means that a taxpayer who is entitled to a refund at the end of the year can access the funds each pay period, rather than waiting until their annual tax return is completed and lodged.
Find out more and find the form...
Read more: The quickest way to improve your cashflow as a property investor.
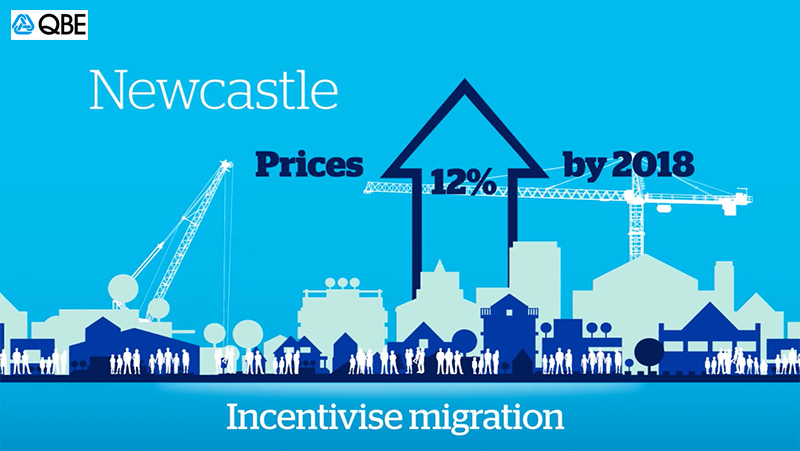 The median price of houses in the Newcastle CBD surpassed $1 million for the first time earlier this year.
Much of this increased sales activity has been the result of Sydney buyers streaming into northern areas hoping to get more far greater value for their money. What you get in areas like Newcastle is so much more than what you get in some parts of Sydney for the same price and that’s largely what is luring Sydneysiders to the area.
Trickledown effects for satellite cities
One of the impacts of Sydney’s extreme growth over the last several years is the positive effect it has on investment property in Newcastle and similar areas. As the BIS Residential Property Prospects 2016 – 2019 report notes, “residential property prices in Newcastle and Wollongong usually benefit when Sydney experiences strong price growth and migration into these regional centres increases”.
According to BIS, over the years to 2018, Newcastle is anticipated to see 15 per cent. Whilst QBE anticipate a solid 12% by 2018 based on Newcastle having a very positive outlook, with new infrastructure spending off-setting the decline in investment in the coal sector. The widening price disparity with Sydney should incentivise migration from Sydney to the region.
Ratings agency S&P said there would not be a sharp price correction in Australian housing and that real estate investment trusts should expect a slowing in the tightening of capitalisation rates despite more offshore capital investing here.
The latest edition of the HIA-CoreLogic RP Data Residential Land Report has just been published by the Housing Industry Association, the voice of Australia’s residential building industry and CoreLogic RP Data, Australia’s leading property information analytics provider. The report covers the December 2015 quarter and provide more evidence of severe supply constraints in the market for residential land.
During the December 2015 quarter, the number of residential lot sales across Australia fell by 1.6 per cent, while the median lot prices increasing by 5.2 per cent to $234,600. Land supply pressures were more pronounced in the capital cities, with lot sales falling by 2.3 per cent during the quarter and the median lot price rising by some 6.6 per cent.
“Conditions in the residential land market are making it more and more difficult to deliver the new housing stock that Australia needs,” noted HIA Senior Economist, Shane Garrett.
“Once again, we’ve had another quarter of dwindling land lot sales and pretty stiff price increases – evidence of insufficient supply,” Shane Garrett explained.
“We need much greater emphasis on the delivery of new residential land supply involving better models for infrastructure delivery and a real sense of urgency in the planning process,” Shane Garrett pointed out.
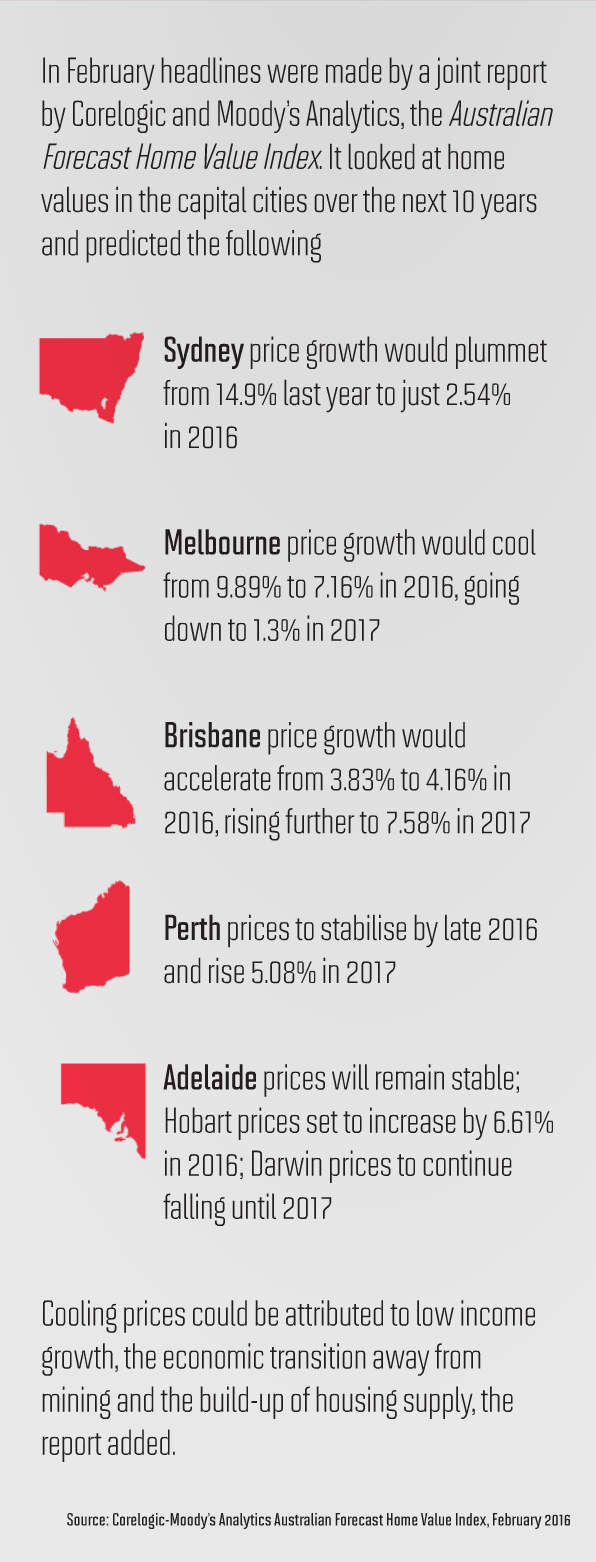 Moody’s Analytics, a leader in risk measurement and management, and CoreLogic, Australia’s leading property data, analytics and market insights company, forecast that home value growth will likely slow across Australia in 2016, following two years of exceptional home value appreciation and double-digit growth in many areas.
This forecast is based on the new CoreLogic-Moody’s Analytics Australian Forecast Home Value Index, launched today, which provides a quarterly projection of the trend of residential home values across the country over the next 10 years. Forecasts are updated monthly to help market participants identify opportunities and manage risk exposures.
“We are excited to partner with Moody’s Analytics to launch this Forecast Index to provide a unique and critical perspective on Australia’s most valuable asset class, currently valued in excess of $6.4 trillion AUD,” said Craig Mackenzie, CoreLogic EGM, Banking & Finance.
“On the outlook for the housing market nationally, we expect house price appreciation to slow in 2016. Our forecast reflects lower income growth as the Australian economy transitions away from mining-related investment, as well as the strong build-up of housing supply over the past two years,” said Alaistair Chan, a Sydney-based economist based at Moody’s Analytics.
“Nevertheless, accommodative policy, robust rental growth, and a recovering labour market are expected to support valuations over the medium term,” adds Chan. The CoreLogic-Moody’s Analytics Australian Forecast Home Value Index currently includes forecasts at a capital city and rest-of-state level.
“Conditions in Melbourne are again expected to outperform Sydney this year, with values forecast to rise by 7.2% in 2016, before slipping back to just 1.3% growth in 2017,” said CoreLogic research director Tim Lawless.
While the pace of house price appreciation is forecast to slow in Sydney, Melbourne and Darwin this year, there is expected to be some pick-up in growth in the remaining capital cities. Hobart, in particular, stands out for better price growth.
For more see article on Corelogic